Defect #1188
Velocity Pie Chart not show in Smart/Web Client
0%
Description
After the upgrade to Servoy 8.1.2 the Velocity Plugin Pie Chart not show in my Html Area
var myPie = plugins.VelocityReport.getChart(CHART.PIE, getPieChartDef(dataset));
var html = '<html><body>'+myPie+'</body></html>';
function getPieChartDef(dataset) {
var year = forms.FrmFacturasGC.fecha_cfa.getFullYear()
var vquery = "select cli.DescCliente, SUM "+
"from [tbFacturaCabecera] oi LEFT JOIN "+
"[tbMaestroClientes] cli ON oi.clie_cfa = cli.IdCliente "+
"where year(fecha_cfa) = "+year+
" group by cli.DescCliente order by 2 desc";
var result = databaseManager.getDataSetByQuery(globals.GCconex,vquery,null,-1)
var chartDef = {};
chartDef.title = "Top 5 Clientes ("+year+")";
chartDef.threeD = true;
chartDef.shadow = true;
chartDef.proportional = true;
chartDef.labelFontSize = 12;
chartDef.width = elements.html.getWidth() - 10/*360*/;
chartDef.height= elements.html.getHeight() - 10;
chartDef.legendPosition = "right";
chartDef.legendMargins = {horizontal: 10, vertical: 2};
chartDef.margins = {top: 10, left: 10, right: 10, bottom: 10};
chartDef.slices = new Array();
var maxRows = dataset.getMaxRowIndex()
/** @type String */
var totalLine = dataset.getColumnAsArray(2)
totalLine = totalLine.join('+')
totalLine = eval(totalLine);
for(var i=1; i <= maxRows; i++)
    {
        result.rowIndex = i;
        var percent = dataset.getValue(i,2);
        var text = dataset.getValue(i,1);
        var color = Colores[i-1];
        var porc = (percent * 100)/totalLine;
        var slice = { percent: percent, label: utils.numberFormat(porc,'###,###,##0.00')+'%', legend: text , color: color };
        chartDef.slices.push(slice);
    }
    chartDef.orientation = 45;
    //etc.
    return chartDef;
}
Files
History
Updated by Patrick Talbot over 8 years ago
- Status changed from New to Feedback
- Assignee set to Javier Arroyo
Can you verify that the update didn't remove the eastwood.war from /application_server/server/webapps/ and that it has been deployed as a folder in that same location?
Velocity uses this war to build charts images, so you need it.
If that's not the issue, then please elaborate, is the pie chart the only chart not working? Or are they all broken?
Do you have any exception in the servoy log? What does myPie contains after the call to getChart()?
Updated by Javier Arroyo over 8 years ago
- File Captura.JPG Captura.JPG added
Patrick Talbot wrote:
Can you verify that the update didn't remove the eastwood.war from /application_server/server/webapps/ and that it has been deployed as a folder in that same location?
Velocity uses this war to build charts images, so you need it.
If that's not the issue, then please elaborate, is the pie chart the only chart not working? Or are they all broken?
Do you have any exception in the servoy log? What does myPie contains after the call to getChart()?
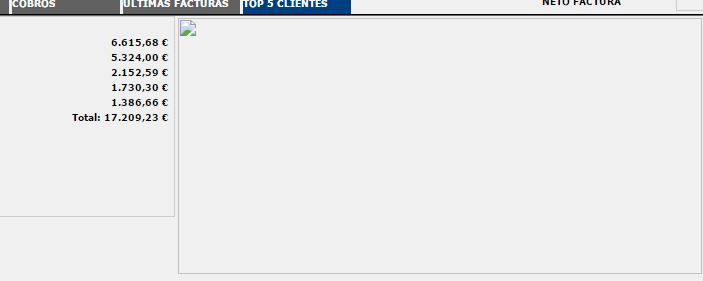
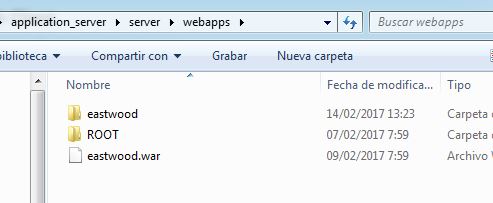
I have eastwood.war in /application_server/server/webapps/ and deployed the folder.(I attach you a screenshot "Captura.JPG")
I follow the instruction in https://www.servoyforge.net/projects/velocity-report/wiki/Installation
In servoy log I have not any exception and after the call to getChart() return me following code:
<img src="http://localhost:8080/eastwood/chart?cht=p3&chdlp=r&chp=45.0&chs=362x191&chts=000000,12&chd=e:YmTzIAGcFK&chma=10,10,10,10|10,2&chtt=Top+5+Clientes+%282017%29&chco=0080FF,00CC66,FF0000,FFFF00,CCCCCC&chl=38%2C44%25|30%2C94%25|12%2C51%25|10%2C05%25|8%2C06%25&chdl=INDUSTRIAS+GOL%2C+S.A.U.|BURNIGAI+S.A.L|TROFEOS+ZUSI%2C+S.L.|TESOLVIT+%2C+S.L.|IMANOL+SANCHEZ+OLASAGASTI&lfs=12&3d=1&xp=1&ewr=1" border="0" class="chart" width="362" height="191"></img>
I try too to import the VelocityReport.servoy solution and the only charts that works is Dial and Code128. The another charts don´t work.
Updated by Patrick Talbot over 8 years ago
Looks like Servoy has updated Tomcat to a version that is no longer accepting ":" and "|" in the url.
I've worked around that by encoding these in the URL, with %3A and %7C, this is fixed in v3.5.51, please update.