Defect #689
xyline chart does not scale correctly
Status:
Resolved
Priority:
Normal
Assignee:
-
Category:
-
Target version:
-
Start date:
04/18/2013
Due date:
% Done:
0%
Estimated time:
Browser (if web client):
Description
I'm using the following google url with the Velocity Chart Script builder:
http://chart.googleapis.com/chart?chxl=0:|1|2|3|4|5|6|7&chxr=0,0,1|1,3.333,100&chxt=x,y&chs=440x220&cht=lxy&chco=3072F3&chd=t:-1|33,0,40,50,20,10,25&chdl=Ponies&chdlp=b&chls=1.333&chma=5,5,5,25
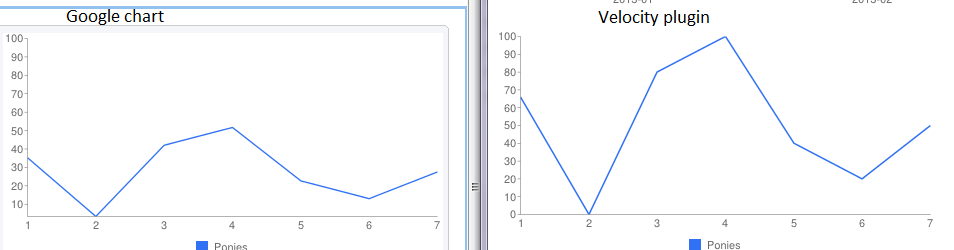
The resulting code shows the chart using wrong scaling for the y-axis. It uses the max value (50) as 100 and scales everyting accordingly.
I've included a screenshot on how the google api shows the chart vs. how the plugin shows the chart.
Files
History
Updated by Patrick Talbot about 12 years ago
- Status changed from New to Resolved
Check out Velocity v3.1rc3 + Velocity Chart Script Builder v1.0.6 which will produce the correct script with autoScaling = false