About
- Table of contents
- About
You're confused about the huge amount of properties available to customize your charts in VelocityReport?
You don't like to READ the docs?
This plugin is a tool to help you quickly and easily build charts using VelocityReport powerful chart engine.
It can be used as a guide or a jump start to master the charting options and build your own charts.
This will save you lots of time when developping charts in Servoy with VelocityReport.
Installation
As a Serclipse plugin, you install it in Servoy Developer.
First download the latest distribution archive from the Files section
The archive is password protected.
You will need to send a Paypal donation of CAD $50 to get the password: simply click that button on the right -->
You will receive the password back in the mailbox you will have used to make the donation.
If you need an invoice for this, I can provide a Paypal invoice, just drop me an email at ptalbot AT free DOT fr.
Note that this is a one time only fee which will give you access to lifetime updates.
Once you've got the zip archive, unzip it (with the password) anywhere on your hard disk.
For our example, let's unzip it to C:/servoy
In Servoy, you will need to add a new update site. Go to "Window > Preferences".
In the Preferences dialog, open the "Install/Update > Available Software Sites":
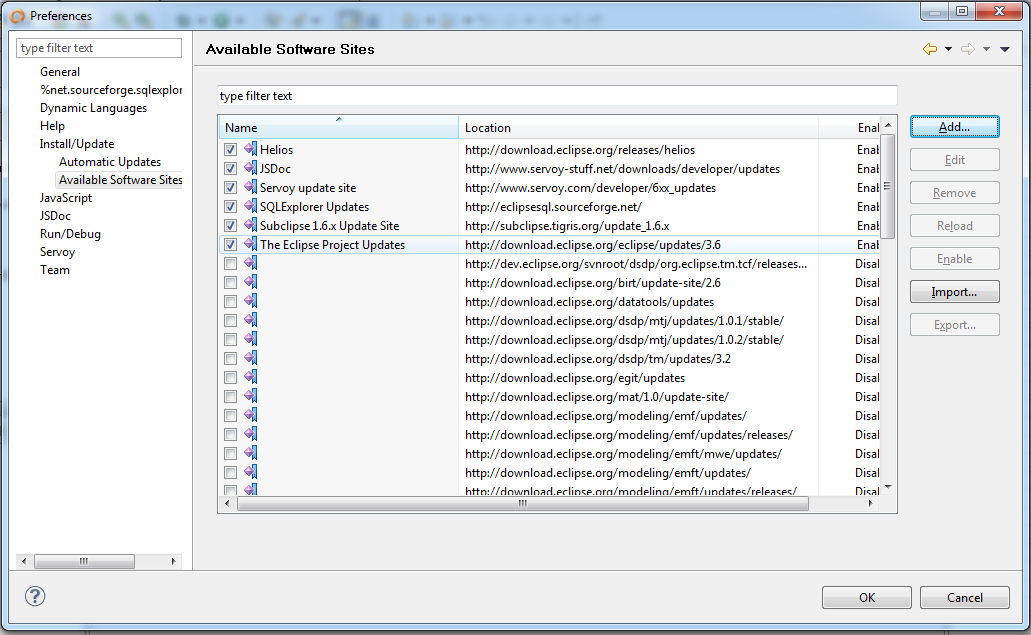
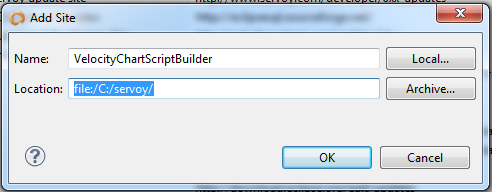
Click "Add..." and set the name of the site to "VelocityChartScriptBuilder" and the location to "file:/C:/servoy" (or any place where you have unzipped the archive), you can use the "Local..." button to browse to that location:
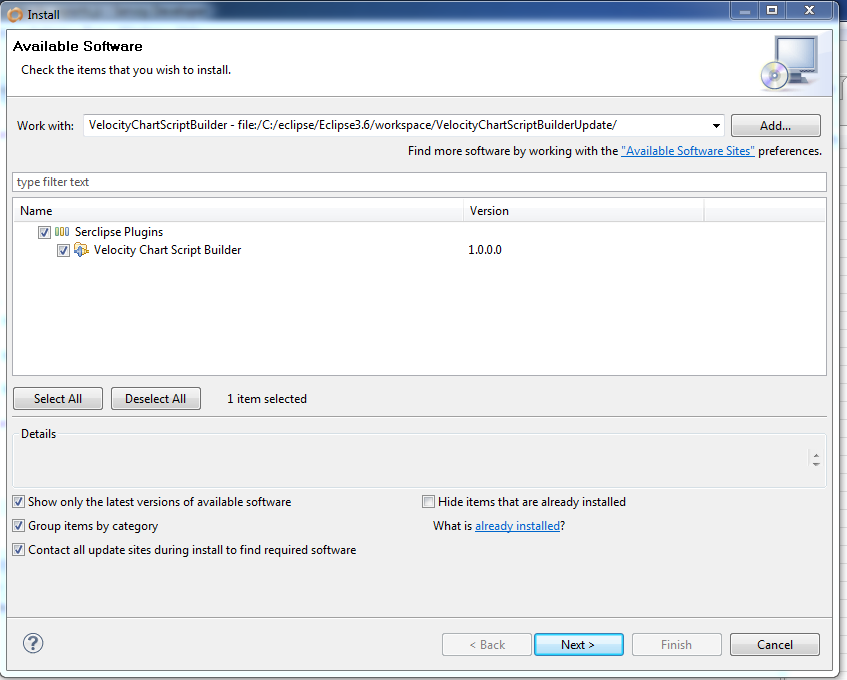
From then on, it's a regular Eclipse plugin install... Go to "Help > Install New Software..." choose to "Work with" VelocityChartScriptBuilder, select the plugin and click "Next >" then follow the instructions.
For an update, all you will have to do is to unzip at the same location and use the "Help > Check for Updates".
Usage
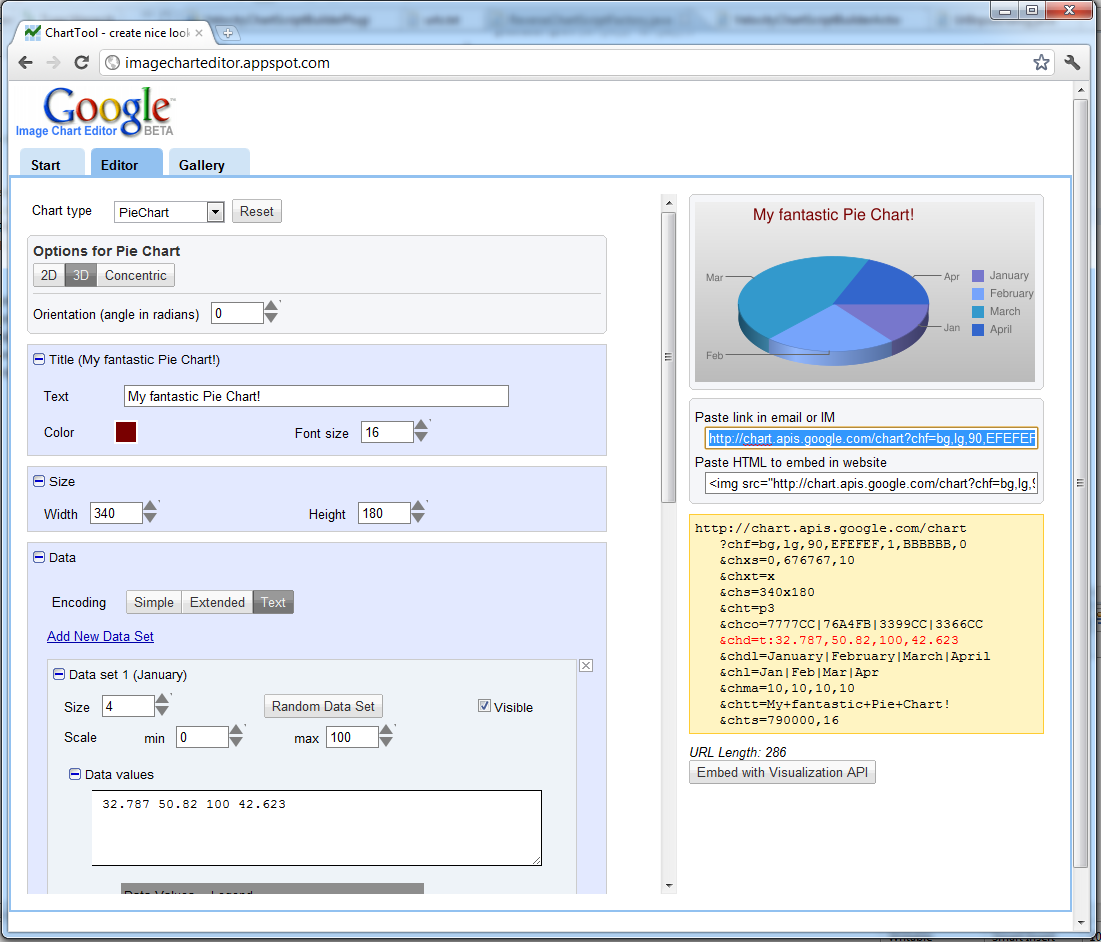
First, create a chart using one of the Google chart online tool available.
I recommend: http://imagecharteditor.appspot.com/
Once created to your satisfaction with sample data, copy the URL - it's the one staring with http://chart.apis.google.com/chart?
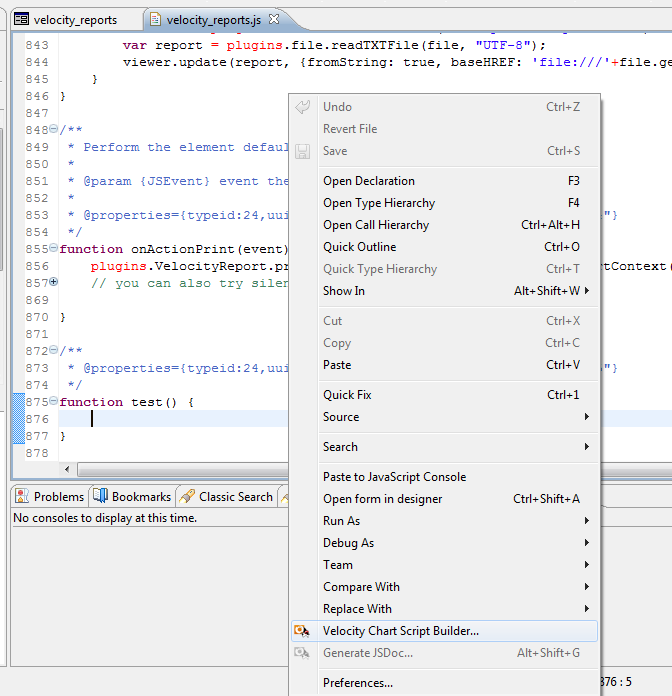
In Servoy, in the Script Editor window, create a blank function and place the cursor inside that function, then right-click...
You should see the editor's popupMenu.
Select the command "Velocity Chart Script Builder...":
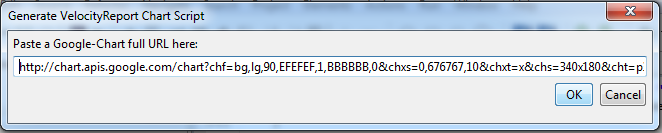
A dialog will open:
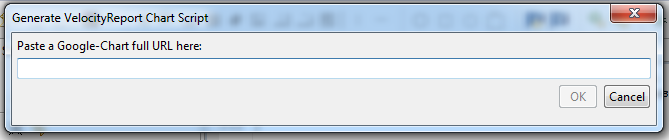
Paste the previously copied Google Chart URL in there (in our example, it's http://chart.apis.google.com/chart?chf=bg,lg,90,BBBBBB,0,EFEFEF,1&chxs=0,676767,10&chxt=x&chs=340x180&cht=p3&chco=7777CC|76A4FB|3399CC|3366CC&chd=t:32.787,50.82,100,42.623&chdl=January|February|March|April&chl=Jan|Feb|Mar|Apr&chma=10,10,10,10&chtt=My+fantastic+Pie+Chart!&chts=790000,16 ) and click OK:
A complete VelocityReport chart generation script will be inserted at the location of the cursor in the Script Editor window:
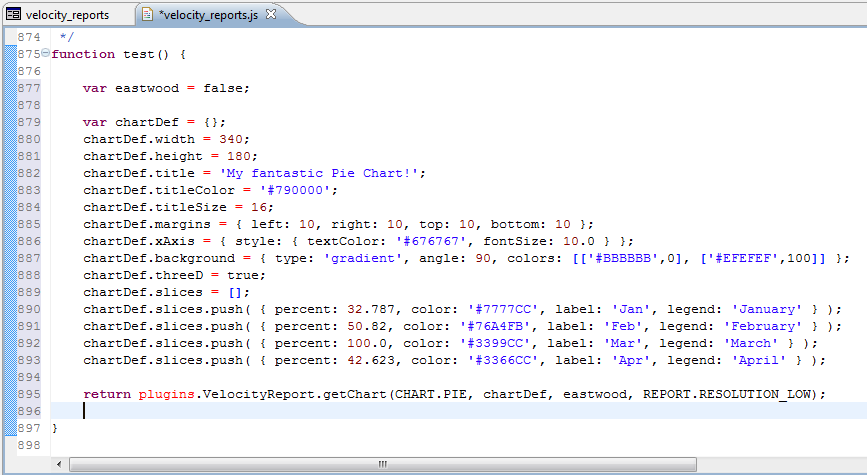
Now you can customize at will!
For example: if you want to use eastwood, simply change the value of the eastwood variable, if you want to change the size of the chart, simply change the chartDef.width and chartDef.height values,
if you prefer high resolution image, change the value in the last call from REPORT.RESOLUTION_LOW to REPORT.RESOLUTION_HIGH.
And of course, you will have to change these static data values by a script to use your own values, either from an Array, a FoundSet or a DataSet.
Calling your function will give you an object that you can use to put in a VelocityReport context, or in a field of type HTML_AREA.
If you want to embed it in an HTML_AREA, just encapsulate the object returned like this:
var chart = theNewFunction();
// html here is the dataProvider of a field ot type HTML_AREA
html = '<html><body style="width: 100%; height: 100%; text-align: center; vertical-align: center">'+chart+'</body></html>';